
Tableau is a powerful data visualization tool used in BI industry. It helps in simplifying raw data into the very easily understandable format. Data analysis is very fast with Tableau and the visualizations created are in the form of dashboards and worksheets.
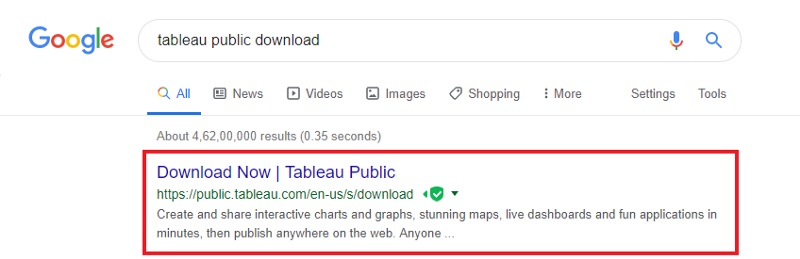
To download Tableau, search Tableau public download on google and go to the link as shown below
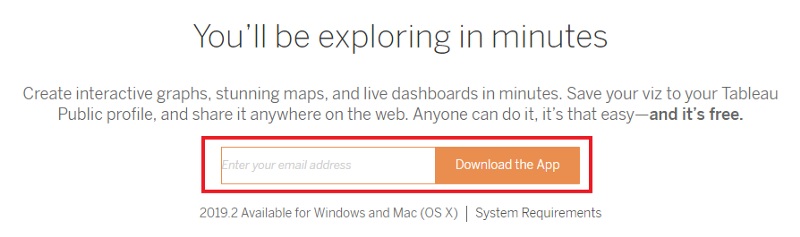
Now enter your email address and click on download the App.
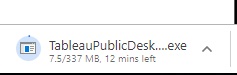
Wait for the installation to get complete.
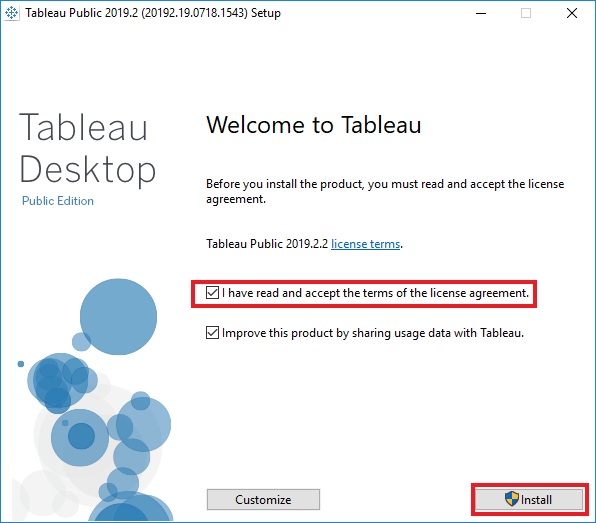
Once the download is complete, open the exe file -> check the checkbox of accept license agreement and click on Install as shown below
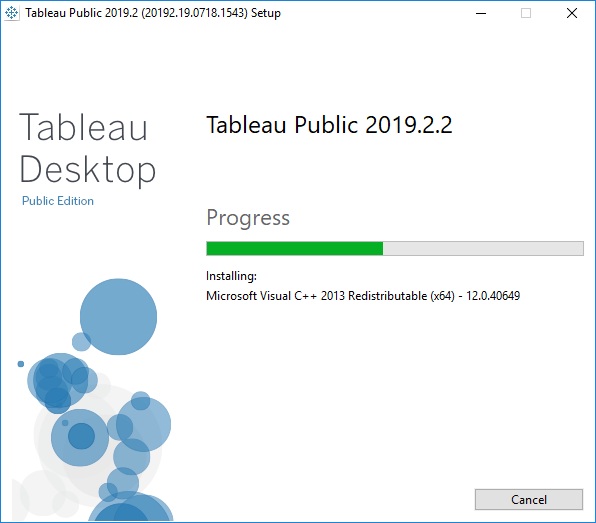
Wait for the Installation progress
Once the Installation is done we will get to see the Tableau tool screen and do the reporting work as well
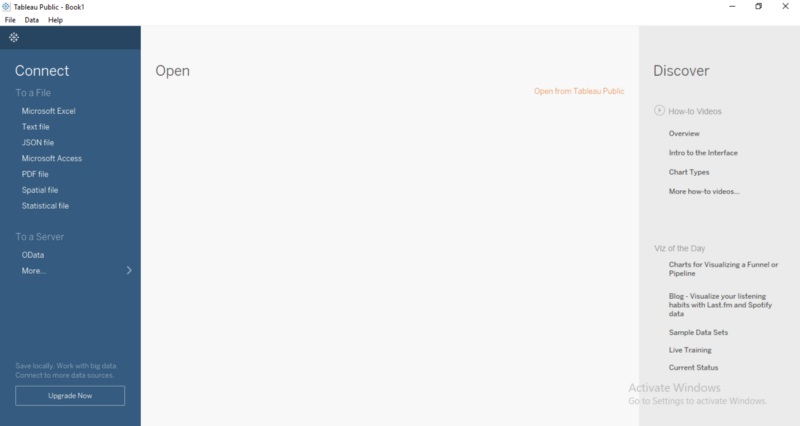
When we have opened Tableau, on the left hand side we can see various different platforms given to connect with Tableau such as Excel, Text file, Server -> OData, Google Sheets, etc.
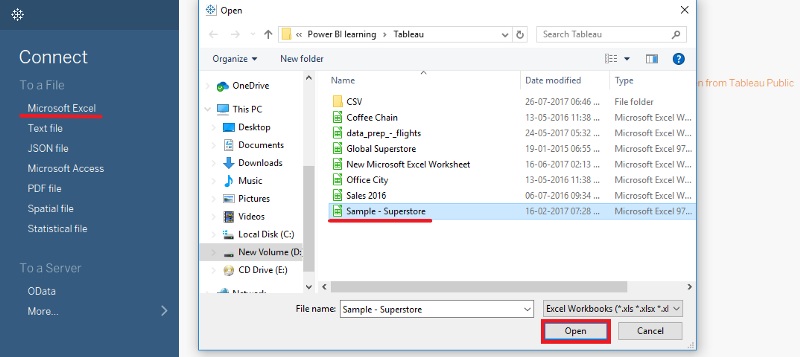
I am going to connect excel file to Tableau For that we need to go to Connect -> Microsoft Excel -> select the file we need to create report on it (in my case I am selecting Sample-Superstore) -> click on Open as shown below
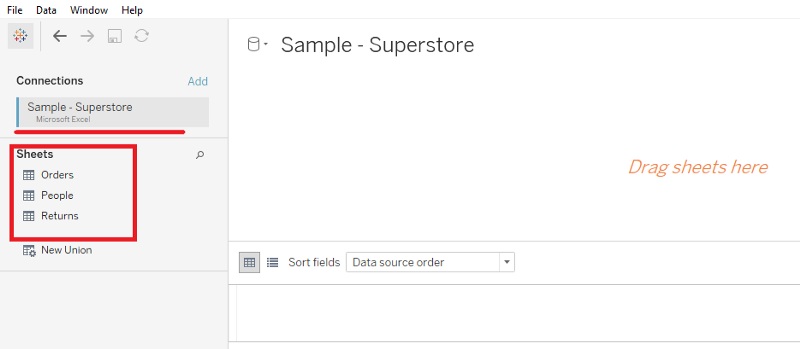
After the above step is done, we will get to see the data or tables available in excel file as shown below
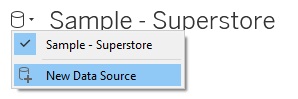
Now if we want to connect another data source to Tabaleau we can do that by going to Data -> New DataSource
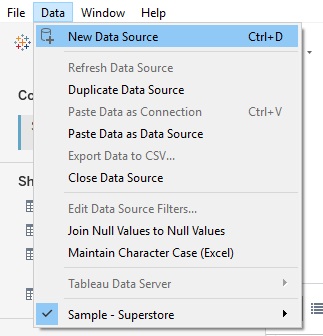
Now by selecting any data source you want you can connect to it. Also u can change data source from given below
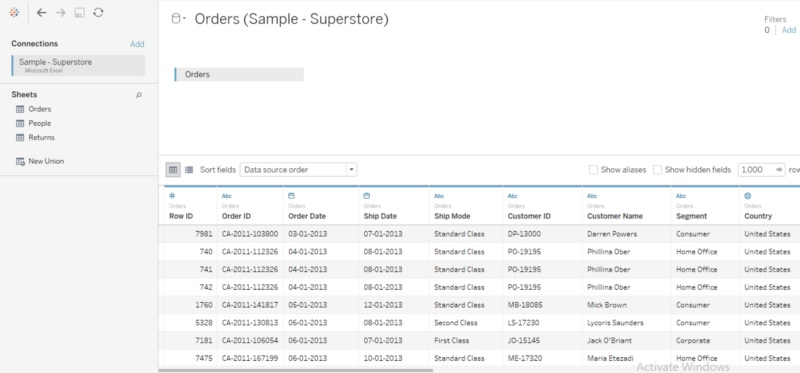
When I drag drop Tables from the sheet, it will display all the data at the bottom as shown below
Here I have just dragged drop one table, if multiple tables are dragged drop we will get to see the joins applied to the tables as shown below
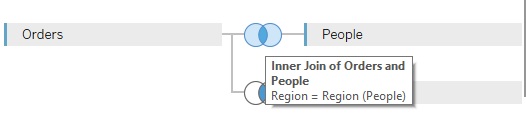
When I kept my cursor in that blue area between tables, it automatically creates an inner join between Tables Orders and People where Region is a common column as shown above
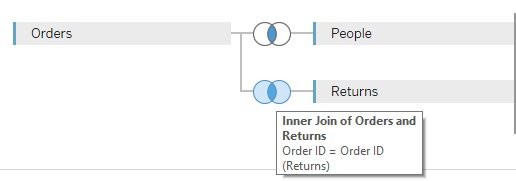
Here Order ID column from both tables are common and Inner Join is automatically created between Tables Orders and Returns.
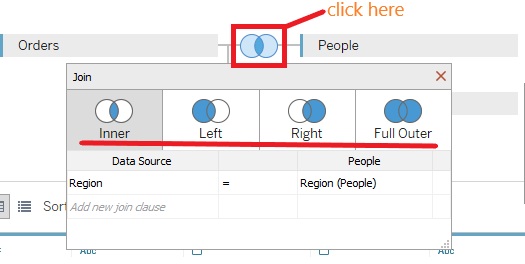
We can also do a left join, right join or full outer join between the tables. We have to click on blue area -> select the join you need to do and see the results below
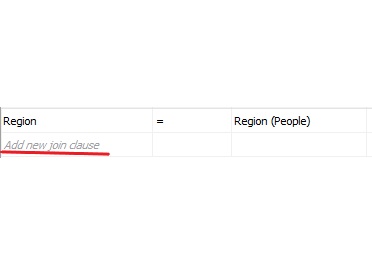
You can also add your new join clause if required by just clicking on 'add new join clause'
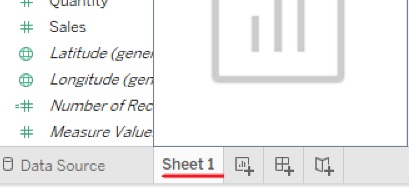
Now to do the reporting work like creating visual, dashboards, etc of report -> Click on Worksheet (Sheet 1) as shown below
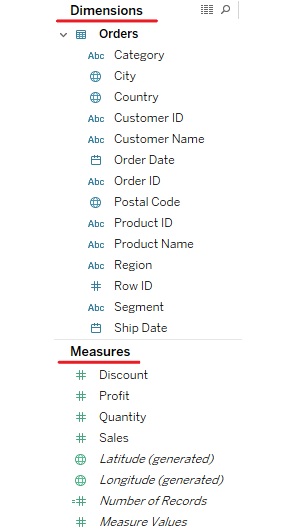
Also we can see that automatically it has created Dimension and Measures as shown below
Now we can drag drop the dimension and measures columns in column and row as shown below
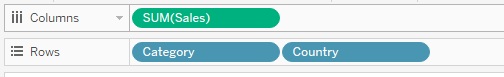
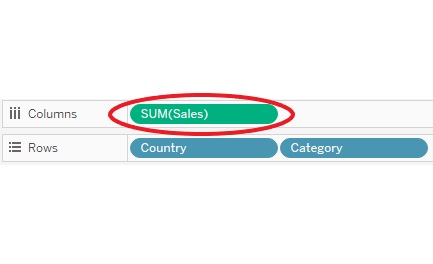
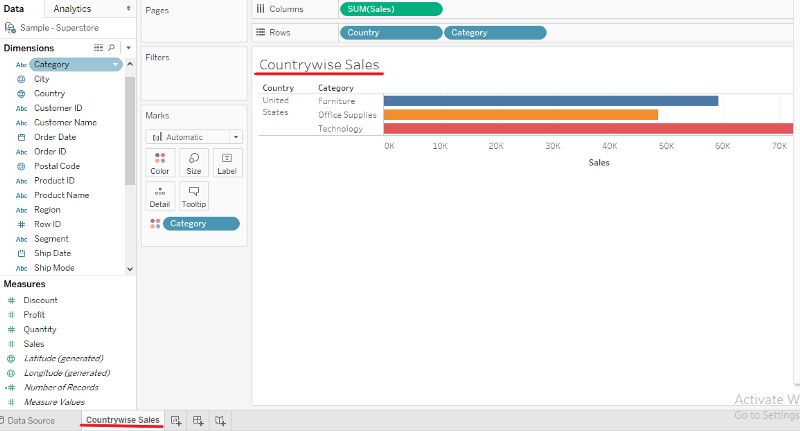
I have Sales in column and Category and Country in rows and lets see the result after this
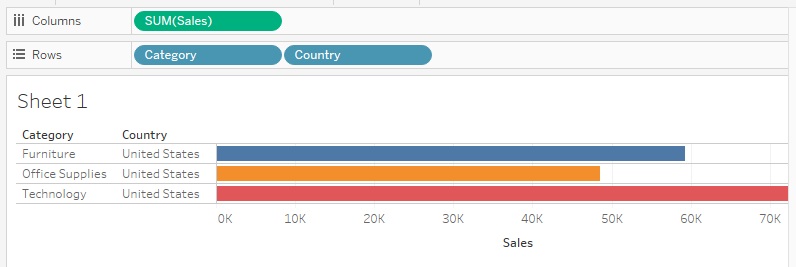
As you can see above I have added two dimensions in Rows shelf. Likewise we can add more than one Dimension/Measures in Rows shelf as well as in Columns shelf too.
One More Important point to be noticed that Measures in Tableau are automatically pre-calculated as SUM.
We can rename the sheet by just right click on Sheet 1 tab and go to Rename as shown below
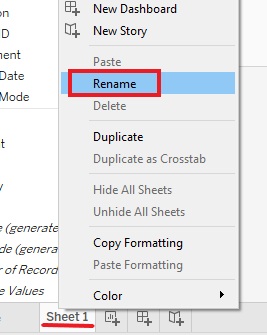
I have renamed the sheet as Countrywise Sales as shown below
There are 3 Cards/Shelf in Tableau
Marks Card:
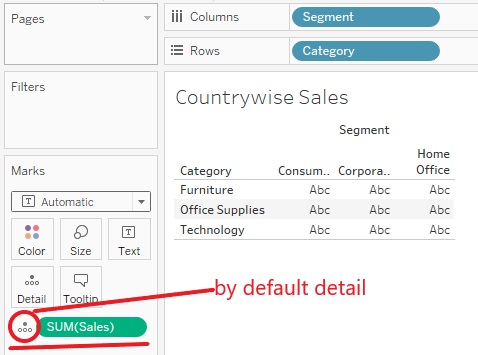
The use of Marks Card is that the Marks data is represented by intersection of dimension present in View.
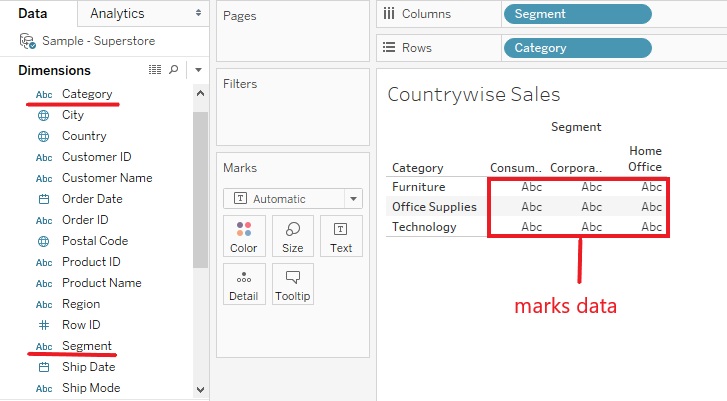
In above image you can see in Rows and Columns shelf we have dimension as Segment and Category respectively. The data available as ABC is the marks data which is intersected between Segment and Category dimensions.
Now as the marks data is in Automatic (i.e. Text) form and if we want to change it to other forms like circle, square, bar, etc then the following steps shown below
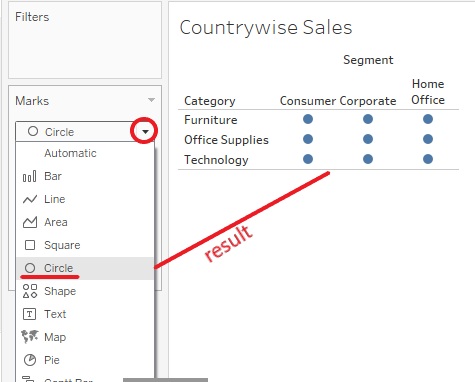
As I have selected circle so it is showing me circle form, likewise we can see data in square, pie, bar, line forms, etc.
The Automatic form is default as it shows the suitability of view.
Also we can show additional information about the view above by selecting the color, size, label, detail, tooltip available in Marks card Now I will add Sales form Measure in Marks card and see the additional information of it.
Drag and Drop the Sum(Sales) in Color and see the additional information is visible on Table as shown below
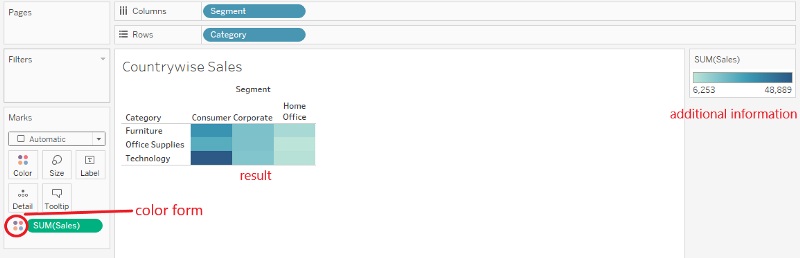
Now In Automatic (Square) form is visible which is suitable for the view and as I have mentioned above we can change the form that we want.
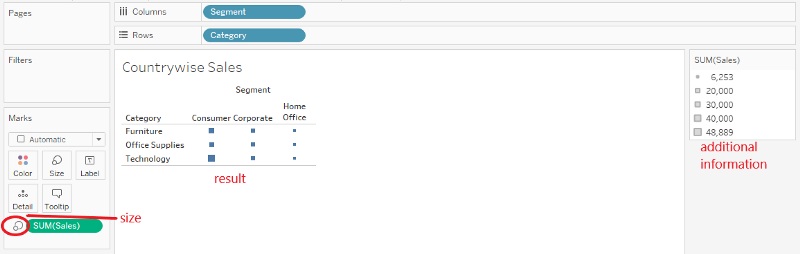
Same now we will do for Size -> Drag and drop Sum(Sales) in Size and see the additional information is visible on Table as shown below
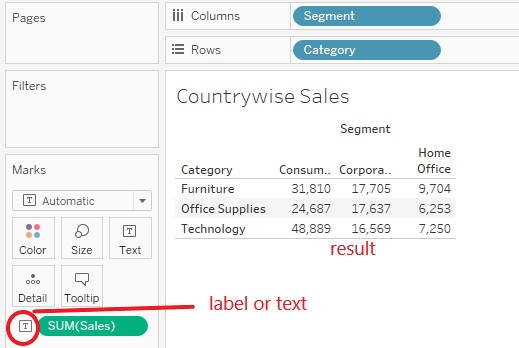
Likewise if I select Label it will show the actual sales amount in Data as shown below
Filters Card:
Filters Card is where we can choose which data to be included and which data is to be excluded in Report using Dimensions and Measures.
To understand the Filters Card we will drag and drop the Sales form Measure in Filters Card -> where we will find variety of filters available like sum, min value, max value, count, etc as shown below
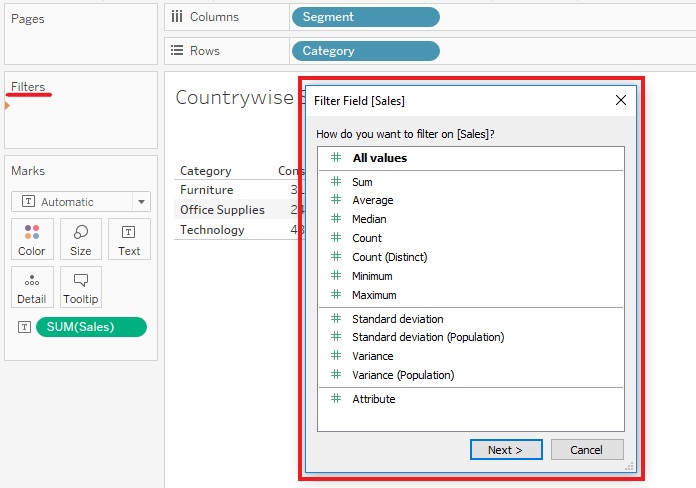
As of now we will select Sum and click on Next.
After we click on Next, we will get various options as Range of Values, Atleast(min), Atmost(max) and Special. Select Range of Values and give the range as per your comfort -> Click on Apply -> Click on OK.
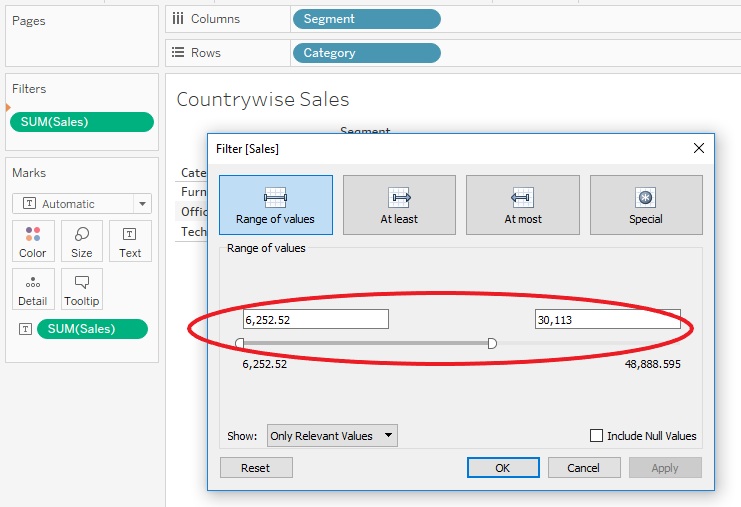
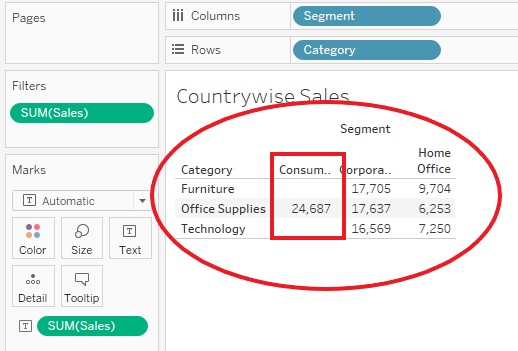
I have given the range from min value to approx 30000 as shown above After clicking on OK we will see the data only from min value to 30000 sales amount and other data will get excluded as shown below.
Pages Card:
Pages Card helps us in dividing the view into series of different pages so that we can better analyze on how the specific field affects the whole data.
To understand Page Card we will drag and drop Sales form Measure in page Card. As soon as we have done this it will create 9 different pages as we 9 data in total as shown below.
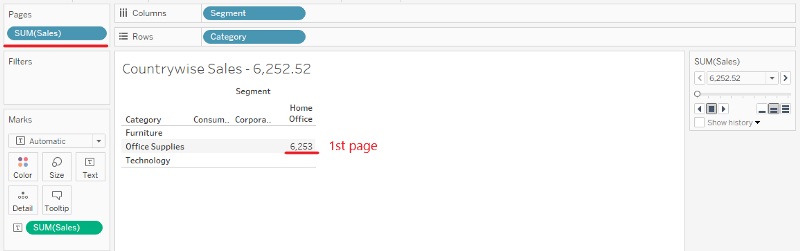
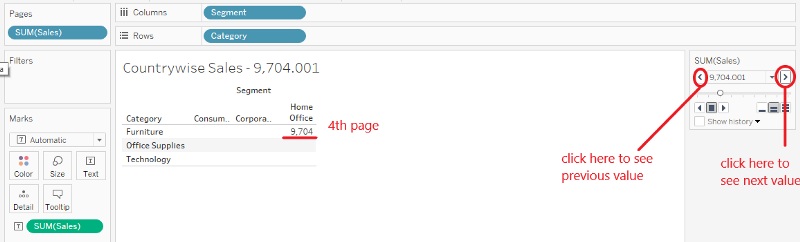
As we can see above only the min value is been displayed and when we click forward button on the right hand side given below , the value 2nd page will be displayed and so on till it reaches the maximum value.
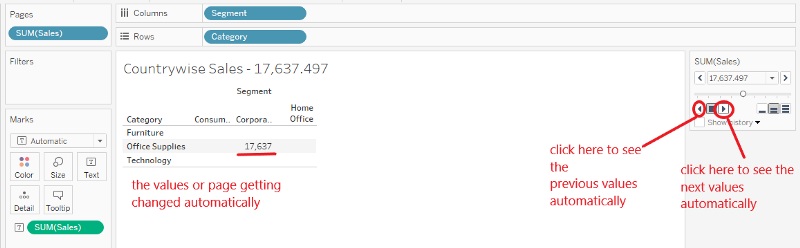
This is the Manual work which we are doing. The values or page will get changed automatically by clicking on Forward button as shown below
Order only MSBI self-study learning video materials which are available with customized package costing 999 INR/15$. Click this link here to see details and order it.